SD - mean
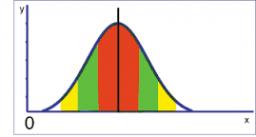
The mean is 10, and the standard deviation is 3.5. If the data set contains 40 data values, approximately how many of the data values will fall within the range of 6.5 to 13.5?
Your answer:
Your answer:
Showing 3 comments:
Ivo
Rule 1 sigma for a normal distribution (from the average on both sides distance standard deviation sigma) lies 68.26% of the values, if are normally distributed.
Dr Math
please use our normal distribution calculator:
https://www.hackmath.net/en/calculator/normal-distribution?mean=10&sd=3.5&above=&below=&area=between&ll=6.5&ul=13.5&outsideLL=&outsideUL=&draw=Calculate
https://www.hackmath.net/en/calculator/normal-distribution?mean=10&sd=3.5&above=&below=&area=between&ll=6.5&ul=13.5&outsideLL=&outsideUL=&draw=Calculate
Tips for related online calculators
Looking for help with calculating arithmetic mean?
Looking for a statistical calculator?
Looking for a standard deviation calculator?
Looking for a statistical calculator?
Looking for a standard deviation calculator?
You need to know the following knowledge to solve this word math problem:
statisticsGrade of the word problem
We encourage you to watch this tutorial video on this math problem: video1
Related math problems and questions:
- Bivariate data set
 Here is a bivariate data set in which you believe y to be the response variable. x y 51.4 44.8 60.2 46.6 60.1 46.8 45.8 46.3 37.4 41.8 72.4 52.5 60 48.2 67.5 49.5 60.9 49.8 51.1 45.7 62.7 49.6 194.9 84.2 Make a scatter plot of this data. Which point is an
 - Life expectancy
 The life expectancy of batteries has a normal distribution with a mean of 350 minutes and a standard deviation of 10 minutes. What is the range in minutes 68% of the batteries will last? What is the range in minutes? How long will approximately 99.7% of b
 - Summaries
 A specialist teacher observes the time taken by each of the students with learning disabilities to complete a psychological task. She summaries the times using the following: Time Taken(mins) ; 1-5; 6-10; 11-12; 16-20 No. of Student ; 2 ; 4 ; 12; 4 Using
 - Tennis aces
 The number of aces served by Novak Djokovic in the last 20 tournaments he has participated in is shown below. 12 17 13 7 8 14 11 14 10 12 15 9 11 13 6 15 18 5 19 24 1.1 using the raw, determine the range. 1.2 Group the data into a frequency distribution w
 - The number 5
 The number of hours per week the television is turned on is determined for each family in a sample. The mean of the data is 35 hours, and the median is 31.2 hours. Twenty-four families in the sample turned on the television for 20 hours or less for the we
 - Coefficient of skewness
 For the data set whose Karl Pearson's Coefficient of skewness = -2.25, variance is 16, and Mean is 35, then its median value will be:
 - Variance and average
 From 40 data values, a mean of mx = 7.5 and a variance of sx = 2.25 were calculated. It is later found that two values were missing: x₄₁ = 3.8 and x₄₂ = 7. Correct the mean and variance.
