Statistical XY file
Year; money spent on advertising; profit (three values each row)
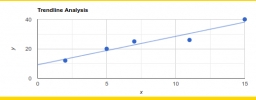
2008 2 12
2009 5 20
2010 7 25
2011 11 26
2012 15 40
1. draw a scatter diagram depicting the data.
2. calculate the Pearson's correlation coefficient.
3. determine the linear regression equation.
2008 2 12
2009 5 20
2010 7 25
2011 11 26
2012 15 40
1. draw a scatter diagram depicting the data.
2. calculate the Pearson's correlation coefficient.
3. determine the linear regression equation.
Correct answer:
Showing 1 comment:
Mathematican
For linear regression we use this calculator:
https://www.hackmath.net/en/calculator/linear-regression?input=2+12%0D%0A5+20%0D%0A7+25%0D%0A11+26%0D%0A15+40
https://www.hackmath.net/en/calculator/linear-regression?input=2+12%0D%0A5+20%0D%0A7+25%0D%0A11+26%0D%0A15+40
Tips for related online calculators
Looking for help with calculating arithmetic mean?
Looking for a statistical calculator?
Looking for a standard deviation calculator?
Looking for a statistical calculator?
Looking for a standard deviation calculator?
You need to know the following knowledge to solve this word math problem:
Related math problems and questions:
- The test 3
 The provided test marks for a small class of student are as follows Don 70%, Jody 68%, Raz 65% and that of Max is not provided. If the class average is 75%, what is Max test marks?
 - Offset the mean
 The mean of 16 numbers is 8. If 2 is added to every number, what will be the new mean?
 - Mean and sum
 If the arithmetic mean of 6 numbers is 45, what is the total sum of these numbers?
 - Multimodal or unimodal
 The weights (in kg) of 13 students of a class are 37,39,33,32,41,33,37,45,43,39, 33,40,39 Find the mode & media of this data (F). Is there more than one mode?
- The mean - mi
 Find the mean of 3 5 8 4 10.
 - Third tests
 Third periodical tests are 98, 97, 86, 94, 90, 97, 91, and 94. Find the median of her grades and interpret the result.
 - Find mean Find the mean of two numbers: -4 and 5 (the first is negative four).
- The median 2 Here is a list of numbers: 9.9, 5.9, 3.6, 6.2, 8.9, 0.7, 4.4, 6.7, 9.9, 0.7 State the median. Give your answer as a decimal.
- The average 12 The average of the first five numbers drawn was 2499. the first four numbers were 4165, 320, 7142, and 64. What was the fifth number?
- The mean 2 The mean cost of 4 items was $39.96. The first item cost $28.50, the second item cost $41.25, and the third item cost $50. Find the cost of the fourth item.
- Correct mean and CV
 For a group of 100 students, the mean and coefficient of variation of their marks were found to be 60 and 25, respectively. Later, it was found that the scores 45 and 70 were wrongly entered as 40 and 27. Find the corrected mean and coefficient of variati
 - IQ scores
 IQ scores are normally distributed with a mean of 100 and a standard deviation of 15. What percentage of the population scores higher than 125 on an IQ test?
 - The endpoints
 The endpoints of a segment are (-6,1) and (10,11). What are the coordinates of its midpoint?
 - The usage The battery usage time installed in a particular smartphone has a Normal distribution with a mean of 25.2 hours and a standard deviation of 7.5 hours. What is the probability of usage time greater than 32?
- Squared deviation Given the data from the problem (sample data: 23, 27, 35, 44), find the sum of the squared deviations (the numerator of the fraction under the square root in the formula). In finding the number, round all calculations to 2 decimals (if you carry more or f
- Variance formula
 Find the variance of 10,10,10,20,20,30.
 - Below 5
 Below is a collection of test scores from a class of 20 students. Make 2 histograms of the data. Choose your own horizontal scales as long as you have more than 4 cells in each histogram. 65 70 68 87 98 91 77 85 70 72 86 86 94 95 67 88 77 99 74 71