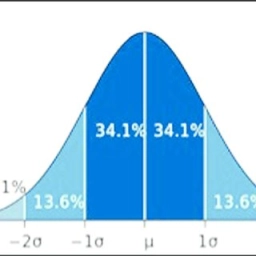
Correct mean and CV
For a group of 100 students, the mean and coefficient of variation of their marks were found to be 60 and 25, respectively. Later, it was found that the scores 45 and 70 were wrongly entered as 40 and 27. Find the corrected mean and coefficient of variation.
Your answer:
Your answer:
Tips for related online calculators
You need to know the following knowledge to solve this word math problem:
statisticsalgebraarithmeticGrade of the word problem
We encourage you to watch this tutorial video on this math problem: video1
Related math problems and questions:
- The raw
 The raw data presented here are the scores (out of 100 marks) of a market survey regarding the acceptability of a new product launched by a company for a random sample of 50 respondents: 40 45 41 45 45 30 30 8 48 25 26 9 23 24 26 29 8 40 41 42 39 35 18 25
 - Salami
 We have six kinds of salami, six of which have ten pieces, and one of which has four pieces. How many ways can we distinctly choose five pieces of salami?
 - Variance and average
 From 40 data values, a mean of mx = 7.5 and a variance of sx = 2.25 were calculated. It is later found that two values were missing: x₄₁ = 3.8 and x₄₂ = 7. Correct the mean and variance.
 - Test scores
 Below is a collection of test scores from a class of 20 students. Make 2 histograms of the data. Choose your own horizontal scales as long as you have more than 4 cells in each histogram. 65 70 68 87 98 91 77 85 70 72 86 86 94 95 67 88 77 99 74 71
 - Z-score
 The mean adult male pulse rate is 67.3 beats per minute, with a standard deviation of 10.3. Find the z-score for an adult male's pulse rate of 75. (Round the z-score to two decimal places. )
 - 3 sigma
 Students' performance scores in a statistic test have a mean of 70 and a standard deviation of 4.0. The scores obtained can be modeled by a normal distribution. Find the probability that the score of a randomly selected student is i. more than 80 marks ii
 - Mean
 The mean of 50 items for a student's food is 38.6. When checking the work, he found that he had taken one item as 50 to read as 40 correctly in these circumstances. What should the correct arithmetic mean?
