Statistical XY file
Year; money spent on advertising; profit (three values each row)
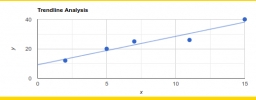
2008 2 12
2009 5 20
2010 7 25
2011 11 26
2012 15 40
1. draw a scatter diagram depicting the data.
2. calculate the Pearson's correlation coefficient.
3. determine the linear regression equation.
Your answer:
2008 2 12
2009 5 20
2010 7 25
2011 11 26
2012 15 40
1. draw a scatter diagram depicting the data.
2. calculate the Pearson's correlation coefficient.
3. determine the linear regression equation.
Your answer:
Showing 1 comment:
Mathematican
For linear regression we use this calculator:
https://www.hackmath.net/en/calculator/linear-regression?input=2+12%0D%0A5+20%0D%0A7+25%0D%0A11+26%0D%0A15+40
https://www.hackmath.net/en/calculator/linear-regression?input=2+12%0D%0A5+20%0D%0A7+25%0D%0A11+26%0D%0A15+40
Tips for related online calculators
Looking for help with calculating arithmetic mean?
Looking for a statistical calculator?
Looking for a standard deviation calculator?
Looking for a statistical calculator?
Looking for a standard deviation calculator?
You need to know the following knowledge to solve this word math problem:
statisticsbasic operations and conceptsGrade of the word problem
Related math problems and questions:
- Marketing
 Year; money spent on advertising; profit 2008 2 12 2009 5 20 2010 7 25 2011 11 26 2012 15 40 1. draw a scatter diagram depicting the data. 2. calculate the Pearson's correlation coefficient. 3. determine the linear regression equation.
 - Statistical example
 Calculate in the set of patients (attached table 1) A) using the table editor EXCEL B) with the program "Social Science Statistics Calculator" (SSSC) on the web page a) the average age of the patients and the standard deviation (STDEV) b) the average dura
 - Statistics quiz
 Fill in the missing word. 1. in a data set, the mean, median, and mode are measured of ________________ 2. "The manipulation of variables under controlled conditions" is the data collection method known as______________ 3. in a normal distribution, the ar
 - Statistical survey Write TRUE OR FALSE for each question: 1 Standard deviation measures central location. 2. The most frequent observation in a data set is known as the mode. 3 The most passive method of data collection is observation. 4 Access time for secondary data is sh
- The airlines
 The airline's company is interested in decreasing the waiting time spent by customers while buying air tickets. So, the relationship between waiting time "y" in minutes and the number of counters "x" operating to sell tickets has been studied (Marks 6) Th
 - Coefficient of skewness For the data set whose Karl Pearson's Coefficient of skewness = -2.25, variance is 16, and Mean is 35, then its median value will be:
- Bivariate data set Here is a bivariate data set in which you believe y to be the response variable. x y 51.4 44.8 60.2 46.6 60.1 46.8 45.8 46.3 37.4 41.8 72.4 52.5 60 48.2 67.5 49.5 60.9 49.8 51.1 45.7 62.7 49.6 194.9 84.2 Make a scatter plot of this data. Which point is an
