Z-score 3
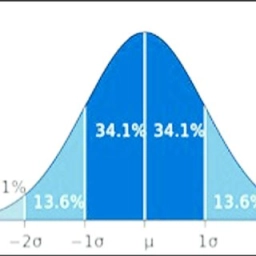
A random variable X has a mean of 4 and a standard deviation of 2. What is the corresponding z-score for x = 7?
Final Answer:

Tips for related online calculators
Looking for help with calculating arithmetic mean?
Looking for a statistical calculator?
Looking for a standard deviation calculator?
Looking for a statistical calculator?
Looking for a standard deviation calculator?
You need to know the following knowledge to solve this word math problem:
statisticsGrade of the word problem
Related math problems and questions:
- Corresponding
 Suppose that the country has had the following inflation rates over the past 14 years: 6.0; 6.7; 10.4; 11.9; 7.2;3.5; 8.4; 7.5; 2.8; 4.3; 1.9; 3.9; 0.9; 0.7. Use the χ² goodness-of-fit test to determine whether the random variable ξ corresponding to this
 - Z score transformation
 Suppose a distribution has a mean µ = 8 and standard deviation σ = 4. What is the value of x if it is z = +1.50?
 - The Uniform Distribution
 The number of tickets purchased by an individual for Beckham colleges holiday music festival is uniformly distributed random variable ranging from 5 to 12. What is the standard deviation?
 - Lifespan
 The lifetime of a light bulb is a random variable with a normal distribution of x = 300 hours, σ = 35 hours. a) What is the probability that a randomly selected light bulb will have a lifespan of more than 320 hours? b) To what value of L hours can the la
 - Probability
 In the election, 2400000 voters out of a total of 6000000 voters voted for party Z. Let us randomly select three voters and consider the random variable ξ={number of voters of party Z in the sample of three voters}. Determine a) the probability distributi
 - Suppose 8
 Suppose the scores on a test have a normal distribution with X=74 and a standard deviation of s=18. What percentage of students have scores higher than 90? What percentage of students have scores between 70 and 85? Twenty percent of the students do better
 - Z score transformation
 The annual salary of an entry-level statistics major (in thousands of dollars) is normally distributed with a mean of 75 and a standard deviation of 12. X ∼ N ( μ = 75, σ = 12 ). What minimum salary should a statistics major aim for to earn amongst the to
