The spinner
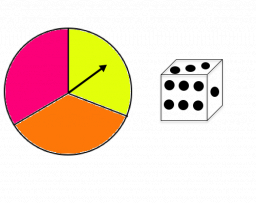
The spinner below is spun 12 times. It landed on I 4 times, II 7 times, and III 1 time. What is the difference between the experimental and theoretical probabilities of landing on the II?
Your answer:
Your answer:
Tips for related online calculators
Would you like to compute the count of combinations?
You need to know the following knowledge to solve this word math problem:
combinatoricsarithmeticplanimetryGrade of the word problem
We encourage you to watch this tutorial video on this math problem: video1
Related math problems and questions:
- Pet store 2
 A pet store is having a prize giveaway. The spinner shows the type of toy a customer can win for their pet. Spinner is divided to 10 sections, and there are 5 cat sections. If a customer spins the spinner and it lands on a cat, they will win a free cat to
 - A coin
 Suppose you tossed a coin 12 times. The coin landed on heads 9 times and on tail 3 times. What is the probability of landing on tails?
 - Summaries
 A specialist teacher observes the time taken by each of the students with learning disabilities to complete a psychological task. She summaries the times using the following: Time Taken(mins) ; 1-5; 6-10; 11-12; 16-20 No. of Student ; 2 ; 4 ; 12; 4 Using
 - Two coins
 Two coins are tossed simultaneously. What is the probability of getting (i) At least one head? (ii) At most one tail? (iii) A head and a tail?
 - Degrees Fahrenheit
 C= (5)/(9)(F−32) The equation above shows how temperature F, measured in degrees Fahrenheit, relates to temperature C, measured in degrees Celsius. Based on the equation, which of the following must be true? I. A temperature increase of 1 degree Fahrenhei
 - The number 7
 The number of faulty units in a carton of a particular product is known to be normally distributed with a Mean of 10 and a variance of 25. What portion of a given carton of the product is expected to contain___ faulty units? (I) less than 8 (ii) more than
 - US GDP
 Consider the following dataset, which contains the domestic US gross in millions of the top-grossing movies over the last five years. 300,452,513,550,780 I. Find the Mean of the Dataset II. Find the Squared deviation of the second observation from the mea
