Statistical deviation
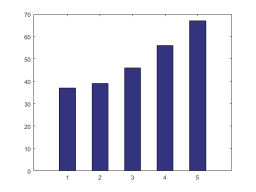
Our school has 59 pupils in year 5, 52 in year 6, 86 in year 7, 70 in year 8, and 71 pupils in year 9.
a) Determine what the statistical population is.
b) Determine what the statistical unit is.
c) Determine what the statistical variable is.
d) Record the given information in a table.
e) Represent the given data graphically using a pie chart.
f) Calculate the mean value of the data set.
Your answer:
a) Determine what the statistical population is.
b) Determine what the statistical unit is.
c) Determine what the statistical variable is.
d) Record the given information in a table.
e) Represent the given data graphically using a pie chart.
f) Calculate the mean value of the data set.
Your answer:
Tips for related online calculators
You need to know the following knowledge to solve this word math problem:
statisticsGrade of the word problem
Related math problems and questions:
- V jedálni
 In the school canteen of an elementary school, a survey was conducted among pupils about their favourite food. The results are shown in the following table: Pancakes; 102 Fried cheese; 81 Spaghetti; 18 Sweet dumplings; 42 Chicken with rice; 30 Determine:
 - Pupils 22
 Pupils of the graduating class at the Business Academy in Banská Bystrica had from the written test in Slovak language the following marks: 2, 2, 3, 3, 1, 4, 4, 2, 3, 5, 3, 3, 3, 4, 2, 4, 1, 1, 2, 3, 4, 5, 1, 3, 3, 2, 2, 3, 2, 1. Create a frequency distri
 - When finding out
 When finding out the number of minor children in 18 households, these results were obtained: 0, 2, 2, 2, 1, 1, 1, 1, 1, 0, 3, 2, 1, 1, 0, 2, 3, 2 . a. Arrange the values of the variable by size. b. Construct a frequency distribution table and calculate re
 - Complaints The table is given: days; complaints 0-4; 2 5-9; 4 10-14; 8 15-19; 6 20-24; 4 25-29; 3 30-34; 3 1.1 What percentage of complaints were resolved within two weeks? 1.2 calculate the mean number of days to resolve these complaints. 1.3 calculate the modal nu
- Sport shooting During small-bore rifle shooting, the following scores were achieved in one series: 9, 9, 8, 9, 10, 6, 8, 9, 9, 10, 8, 7, 6. a. Arrange the values in ascending order. b. Construct a frequency distribution table and calculate the relative frequencies and r
- Statistical example
 Calculate in the set of patients (attached table 1) A) using the table editor EXCEL B) with the program "Social Science Statistics Calculator" (SSSC) on the web page a) the average age of the patients and the standard deviation (STDEV) b) the average dura
 - Pupils - dataset The following data on the height and the corresponding number of pupils were found in the measurement of 63 pupils: the height; number of pupils 159 cm; 1 161 cm; 1 162 cm; 2 163 cm; 1 164 cm; 2 165 cm; 2 166 cm; 3 167 cm; 2 168 cm; 4 169 cm; 3 170 cm; 5
