Pupils 22
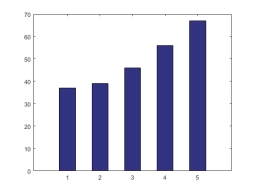
Pupils of the graduating class at the Business Academy in Banská Bystrica had from the written test in Slovak language the following marks: 2, 2, 3, 3, 1, 4, 4, 2, 3, 5, 3, 3, 3, 4, 2, 4, 1, 1, 2, 3, 4, 5, 1, 3, 3, 2, 2, 3, 2, 1.
Create a frequency distribution table, determine what is the statistical set, statistical unit, what statistical variable we observe, what is the range of the set, determine the maximum and minimum value of the variable, the range of variation, and the central values (mode, median, mean).
Your answer:
Tips for related online calculators
You need to know the following knowledge to solve this word math problem:
statisticsGrade of the word problem
Related math problems and questions:
- When finding out
 When finding out the number of minor children in 18 households, these results were obtained: 0, 2, 2, 2, 1, 1, 1, 1, 1, 0, 3, 2, 1, 1, 0, 2, 3, 2 . a. Arrange the values of the variable by size. b. Construct a frequency distribution table and calculate re
 - V jedálni
 In the school canteen of an elementary school, a survey was conducted among pupils about their favourite food. The results are shown in the following table: Pancakes; 102 Fried cheese; 81 Spaghetti; 18 Sweet dumplings; 42 Chicken with rice; 30 Determine:
 - Statistical file characteristics
 Determine the median, mode, arithmetic mean, variance, standard deviation, range of variation, and coefficient of variation of the character x in the statistical file: 2x 9, 7x 10, 9x 11, 11x 15, 15x 17, 16x 19, 13x 21, 10x 25, 9x 29, 4x 32
 - Sport shooting During small-bore rifle shooting, the following scores were achieved in one series: 9, 9, 8, 9, 10, 6, 8, 9, 9, 10, 8, 7, 6. a. Arrange the values in ascending order. b. Construct a frequency distribution table and calculate the relative frequencies and r
- Mark statistics frequency Marks with equal weight 2,1,3,2,2,3,1,3,1,1,2,4,2,2,3,1,1,2,1,3 specify: 1) arithmetic mean 2) absolute and relative frequency 3) mode and median 4) create a chart
- Statistical deviation
 Our school has 59 pupils in year 5, 52 in year 6, 86 in year 7, 70 in year 8, and 71 pupils in year 9. a) Determine what the statistical population is. b) Determine what the statistical unit is. c) Determine what the statistical variable is. d) Record the
 - Median and modus
 Rachel rolled a die 50 times. The table shows the frequency of each face: Face Number: 1 2 3 4 5 6 Frequency: 8 7 5 11 6 13 Calculate the mode and median of the face numbers that Rachel rolled.
