Statistical file characteristics
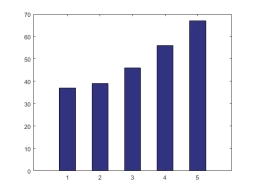
Determine the median, mode, arithmetic mean, variance, standard deviation, range of variation, and coefficient of variation of the character x in the statistical file:
2x 9, 7x 10, 9x 11, 11x 15, 15x 17, 16x 19, 13x 21, 10x 25, 9x 29, 4x 32
2x 9, 7x 10, 9x 11, 11x 15, 15x 17, 16x 19, 13x 21, 10x 25, 9x 29, 4x 32
Final Answer:

Tips for related online calculators
Looking for help with calculating arithmetic mean?
Looking for a statistical calculator?
Looking for a standard deviation calculator?
Need help calculating sum, simplifying, or multiplying fractions? Try our fraction calculator.
Looking for a statistical calculator?
Looking for a standard deviation calculator?
Need help calculating sum, simplifying, or multiplying fractions? Try our fraction calculator.
You need to know the following knowledge to solve this word math problem:
statisticsarithmeticnumbersGrade of the word problem
We encourage you to watch this tutorial video on this math problem: video1
Related math problems and questions:
- Statistical Data Analysis
 For the statistical file: 2.3; 3.4; 1.8; 3.2; 3.2; 1.9; 3.3; 4.5; 4.3; 5.0; 4.8; 4.3; 4.3; 1.9 Determine the sample variance and the median, and from the empirical distribution function, determine P (2.1
 - Controller
 The output Controller of the company, in the control of 50 randomly selected products, found that 37 of them had no defects, eight had only one flaw, three had two defects, and two products had three defects. Determine the standard deviation and coefficie
 - Pupils - dataset
 The following data on the height and the corresponding number of pupils were found in the measurement of 63 pupils: the height; number of pupils 159cm; 1 161cm; 1 162cm; 2 163cm; 1 164cm; 2 165cm; 2 166cm; 3 167cm; 2 168cm; 4 169cm; 3 170cm; 5 171cm; 6 17
 - Coefficient of skewness
 For the data set whose Karl Pearson's Coefficient of skewness = -2.25, variance is 16, and Mean is 35, then its median value will be:
 - Summaries
 A specialist teacher observes the time taken by each of the students with learning disabilities to complete a psychological task. She summaries the times using the following: Time Taken(mins) ; 1-5; 6-10; 11-12; 16-20 No. of Student ; 2 ; 4 ; 12; 4 Using
 - Dataset 3
 Given dataset: 31, 28, 31,30,31,30,31,31,30,31,30,31 1. Construct a frequency table. 2. Construct a histogram. 3. Compute the mean. 4. Compute the median. 5. Find the mode. 6. Compute the midrange. 7. Compute the standard deviation.
 - A sample
 A sample of 10 randomly selected students revealed the following grades in Business Statistics first test (on a marking scale of 0 to 100): 79, 63, 60, 45, 55, 58, 59, 62, 40, 68. Examine the data using groups and presenting: a) the Histogram of the absol
