A sample
A sample of 10 randomly selected students revealed the following grades in
Business Statistics first test (on a marking scale of 0 to 100): 79, 63, 60, 45, 55, 58, 59, 62, 40, 68. Examine the data using groups and presenting:
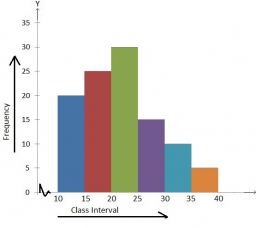
a) the Histogram of the absolute frequencies and the polygon;
b) the Histogram of the relative frequencies;
c) the Histogram of the cumulative frequencies and the ogive;
d) the Mean;
e) the Median;
f) the Mode;
g) the Variance;
h) the Standard deviation;
i) the Coefficient of Variance;
j) the Coefficient of Pearson and discuss the skewness briefly.
Make a table consisting of columns with the necessary calculations concerning the above
information.
Final Answer:

Tips for related online calculators
Looking for help with calculating arithmetic mean?
Looking for a statistical calculator?
Looking for a standard deviation calculator?
Looking for a statistical calculator?
Looking for a standard deviation calculator?
You need to know the following knowledge to solve this word math problem:
statisticsGrade of the word problem
Related math problems and questions:
- Coefficient of skewness
 For the data set whose Karl Pearson's Coefficient of skewness = -2.25, variance is 16, and Mean is 35, then its median value will be:
 - Summaries
 A specialist teacher observes the time taken by each of the students with learning disabilities to complete a psychological task. She summaries the times using the following: Time Taken(mins) ; 1-5; 6-10; 11-12; 16-20 No. of Student ; 2 ; 4 ; 12; 4 Using
 - Dataset 3
 Given dataset: 31, 28, 31,30,31,30,31,31,30,31,30,31 1. Construct a frequency table. 2. Construct a histogram. 3. Compute the mean. 4. Compute the median. 5. Find the mode. 6. Compute the midrange. 7. Compute the standard deviation.
 - Pupils - dataset
 The following data on the height and the corresponding number of pupils were found in the measurement of 63 pupils: the height; number of pupils 159cm; 1 161cm; 1 162cm; 2 163cm; 1 164cm; 2 165cm; 2 166cm; 3 167cm; 2 168cm; 4 169cm; 3 170cm; 5 171cm; 6 17
 - Dataset:
 Dataset: 35 22 18 54 22 46 28 31 43 22 14 17 25 19 33 14. 1 Group the data into a grouped distribution using six classes of equal width. 2. Determine the mean, median, and mode using the raw data. 3. Draw an Ogive curve corresponding to the data and use i
 - A frequency
 A frequency table of grades has five classes (A, B, C, D, F) with frequencies of 2,14,13,8, and 1, respectively. Using percentages, what are the relative frequencies of the five classes?
 - Statistical file characteristics
 Determine the median, mode, arithmetic mean, variance, standard deviation, range of variation, and coefficient of variation of the character x in the statistical file: 2x 9, 7x 10, 9x 11, 11x 15, 15x 17, 16x 19, 13x 21, 10x 25, 9x 29, 4x 32
