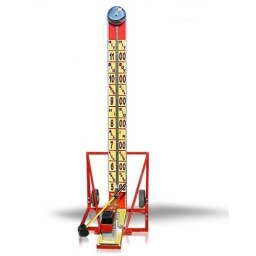
Ring The Bell
Lucy and David challenged each other at the "Ring The Bell" game. David scored 120 points, although Lucy and David scored 235 points. How many points did Lucy score?
Draw a diagram and equation to represent this situation. Use 'L' as the missing var.
Draw a diagram and equation to represent this situation. Use 'L' as the missing var.
Final Answer:

Tips for related online calculators
Do you have a linear equation or system of equations and are looking for its solution? Or do you have a quadratic equation?
You need to know the following knowledge to solve this word math problem:
algebranumbersGrade of the word problem
Related math problems and questions:
- Acting
 Two locomotives are involved in a train set. One locomotive pulls the train, and the other pushes it. The pulling locomotive exerts a force of 500 kN on the train, and the pushing locomotive exerts a force of 400 kN. a) Draw a diagram of the described sit
 - Marilyn
 Marilyn has a fish tank that contains 39 fish. There are five goldfish and f other fish. Enter an equation, using f as your variable, to represent the situation.
 - Tadeo
 Tadeo volunteered at the library 6 times as many hours over the weekend as Dylan. Together, they volunteered a total of 14 hours. How many hours did each person volunteer over the weekend? Write a system of equations that represents the situation. Let x r
 - Diala
 Diala bought some books in 2012, and then during 2013, she bought 3 times as many books as she bought in 2012. Diala bought 48 books during these two years. Make a diagram to represent the given. How many books did Diala buy each year?
 - Laila
 Laila is 3/2 m tall, which is 4/5 as tall as Shanika. How tall is Shanika? What formula or equation does represent this situation?
 - Tournament 3524
 Four hockey teams scored 337 goals in the tournament. The second team scored 16 goals less than the first, the third 17 less than the second, and the fourth 30 goals less than the second. How many goals did each team score?
 - Ball game
 Richard, Denis, and Denise together scored 932 goals. Denis scored four goals over Denise, but Denis scored 24 goals less than Richard. Determine the number of goals for each player.
