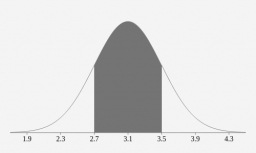
Confidence Interval
The average grade of 50 senior students in a statistics class is 85, with a standard deviation of 10.2. In comparison, 60 senior students got an average of 80 with a standard deviation of 8.9. Can the difference in the mean grade be attributed to chance, using a 0.05 level of significance?
Final Answer:

Tips for related online calculators
Looking for help with calculating arithmetic mean?
Looking for a statistical calculator?
Looking for a standard deviation calculator?
Looking for a statistical calculator?
Looking for a standard deviation calculator?
You need to know the following knowledge to solve this word math problem:
Related math problems and questions:
- Two methods
 A teacher wishes to teach verbs to his English class using two methods. He randomly divided the class into two samples of 14 students each. Using Method 1, the students learned an average of 43.8 with a standard deviation of 4.6, while the second group (M
 - A professor
 A professor in a typing class found out that the average performance of an expert typist is 85 words per minute. A random sample of 16 students took the typing test, and we obtained an average speed of 62 words per minute with a standard deviation of 8. C
 - A student 2
 A student randomly selected 225 college students and asked whether they had eaten breakfast that morning before coming to campus. Fifty-seven students were at least 25 years old, and 30 had breakfast that morning. Of the 168 students younger than 25, 82 h
 - A random
 A random sample of 225 nails in a manufacturing company is gathered. The engineer specified that the specified length of a nail must be 8 cm having a standard deviation of 0.04 cm. It shows from the sample that the average length of the nails is 8.055 cm.
 - Pupils - dataset
 The following data on the height and the corresponding number of pupils were found in the measurement of 63 pupils: the height; number of pupils 159cm; 1 161cm; 1 162cm; 2 163cm; 1 164cm; 2 165cm; 2 166cm; 3 167cm; 2 168cm; 4 169cm; 3 170cm; 5 171cm; 6 17
 - A sample
 A sample of 10 randomly selected students revealed the following grades in Business Statistics first test (on a marking scale of 0 to 100): 79, 63, 60, 45, 55, 58, 59, 62, 40, 68. Examine the data using groups and presenting: a) the Histogram of the absol
 - Performance comparing
 A standardized test was administered to thousands of students with a mean score of 85 and a standard deviation of 8. A random sample of 50 students was given the same test and showed an average score of 83.20. Is there evidence that this group performs le
