Two methods
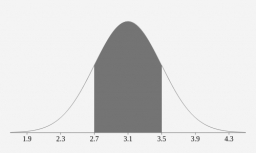
A teacher wishes to teach verbs to his English class using two methods. He randomly divided the class into two samples of 14 students each. Using Method 1, the students learned an average of 43.8 with a standard deviation of 4.6, while the second group (Method 2) got an average of 38.6 with a standard deviation of 5. Method 1 is superior to Method 2. Test using a 0.01 level of significance.
Final Answer:

Tips for related online calculators
Looking for help with calculating arithmetic mean?
Looking for a statistical calculator?
Looking for a standard deviation calculator?
Looking for a statistical calculator?
Looking for a standard deviation calculator?
You need to know the following knowledge to solve this word math problem:
Related math problems and questions:
- Confidence Interval
 The average grade of 50 senior students in a statistics class is 85, with a standard deviation of 10.2. In comparison, 60 senior students got an average of 80 with a standard deviation of 8.9. Can the difference in the mean grade be attributed to chance,
 - A professor
 A professor in a typing class found out that the average performance of an expert typist is 85 words per minute. A random sample of 16 students took the typing test, and we obtained an average speed of 62 words per minute with a standard deviation of 8. C
 - A student 2
 A student randomly selected 225 college students and asked whether they had eaten breakfast that morning before coming to campus. Fifty-seven students were at least 25 years old, and 30 had breakfast that morning. Of the 168 students younger than 25, 82 h
 - Suppose 12
 Suppose in a physics test involving 30 students, and four scored 75%, eight scored 60%, twelve scored 50%, and six scored 30%. Calculate the mean of the group and the standard deviation.
 - Two sigma
 Khail took his math test and scored 88. If the class average was 78 with a standard deviation of 5, what percent of students earned a higher grade than Khail's grade?
 - The raw
 The raw data presented here are the scores (out of 100 marks) of a market survey regarding the acceptability of a new product launched by a company for a random sample of 50 respondents: 40 45 41 45 45 30 30 8 48 25 26 9 23 24 26 29 8 40 41 42 39 35 18 25
 - Dataset:
 Dataset: 35 22 18 54 22 46 28 31 43 22 14 17 25 19 33 14. 1 Group the data into a grouped distribution using six classes of equal width. 2. Determine the mean, median, and mode using the raw data. 3. Draw an Ogive curve corresponding to the data and use i
