Suppose 12
Suppose in a physics test involving 30 students, and four scored 75%, eight scored 60%, twelve scored 50%, and six scored 30%. Calculate the mean of the group and the standard deviation.
Your answer:
Your answer:
Tips for related online calculators
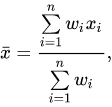
Looking for help with calculating arithmetic mean?
Looking for a statistical calculator?
Looking for a standard deviation calculator?
Our percentage calculator will help you quickly and easily solve a variety of common percentage-related problems.
Looking for a statistical calculator?
Looking for a standard deviation calculator?
Our percentage calculator will help you quickly and easily solve a variety of common percentage-related problems.
You need to know the following knowledge to solve this word math problem:
statisticsarithmeticbasic operations and concepts
Related math problems and questions:
- Suppose 8
 Suppose the scores on a test have a normal distribution with X=74 and a standard deviation of s=18. What percentage of students have scores higher than 90? What percentage of students have scores between 70 and 85? Twenty percent of the students do better
 - Two sigma
 Khail took his math test and scored 88. If the class average was 78 with a standard deviation of 5, what percent of students earned a higher grade than Khail's grade?
 - 3 sigma Students' performance scores in a statistic test have a mean of 70 and a standard deviation of 4.0. The scores obtained can be modeled by a normal distribution. Find the probability that the score of a randomly selected student is i. more than 80 marks ii
- Two methods
 A teacher wishes to teach verbs to his English class using two methods. He randomly divided the class into two samples of 14 students each. Using Method 1, the students learned an average of 43.8 with a standard deviation of 4.6, while the second group (M
 - Pupils - dataset
 The following data on the height and the corresponding number of pupils were found in the measurement of 63 pupils: the height; number of pupils 159 cm; 1 161 cm; 1 162 cm; 2 163 cm; 1 164 cm; 2 165 cm; 2 166 cm; 3 167 cm; 2 168 cm; 4 169 cm; 3 170 cm; 5
 - A sample
 A sample of 10 randomly selected students revealed the following grades in Business Statistics first test (on a marking scale of 0 to 100): 79, 63, 60, 45, 55, 58, 59, 62, 40, 68. Examine the data using groups and presenting: a) the Histogram of the absol
 - Z-score
 The mean adult male pulse rate is 67.3 beats per minute, with a standard deviation of 10.3. Find the z-score for an adult male's pulse rate of 75. (Round the z-score to two decimal places. )
