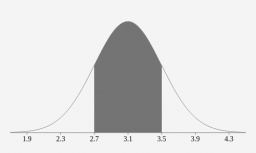
Unemployment rate
Over the last 16 years, the country's unemployment rate has changed according to the following frequency table:
years of unemployment: 2 5 2 3 3 1
unemployment rate: 0.5 1 1.5 2 2.5 3 in % (percent).
Determine the two-sided confidence interval for the variance DN with a confidence level of 0.95.
years of unemployment: 2 5 2 3 3 1
unemployment rate: 0.5 1 1.5 2 2.5 3 in % (percent).
Determine the two-sided confidence interval for the variance DN with a confidence level of 0.95.
Final Answer:

Tips for related online calculators
Looking for help with calculating arithmetic mean?
Looking for a statistical calculator?
Looking for a standard deviation calculator?
Our percentage calculator will help you quickly and easily solve a variety of common percentage-related problems.
Looking for a statistical calculator?
Looking for a standard deviation calculator?
Our percentage calculator will help you quickly and easily solve a variety of common percentage-related problems.
You need to know the following knowledge to solve this word math problem:
statisticsbasic operations and conceptsGrade of the word problem
We encourage you to watch this tutorial video on this math problem: video1
Related math problems and questions:
- Corresponding
 Suppose that the country has had the following inflation rates over the past 14 years: 6.0; 6.7; 10.4; 11.9; 7.2;3.5; 8.4; 7.5; 2.8; 4.3; 1.9; 3.9; 0.9; 0.7. Use the χ² goodness-of-fit test to determine whether the random variable ξ corresponding to this
 - Standard deviation
 Find the standard deviation for the dataset (grouped data): Age (years); No. Of Persons 0-10 ; 15 10-20 ; 15 20-30 ; 23 30-40 ; 22 40-50 ; 25 50-60 ; 10 60-70 ; 5 70-80 ; 10
 - Confidence Interval
 The average grade of 50 senior students in a statistics class is 85, with a standard deviation of 10.2. In comparison, 60 senior students got an average of 80 with a standard deviation of 8.9. Can the difference in the mean grade be attributed to chance,
 - Three sigma rule
 The height of trees in a given stand is known to be a quantity with a normal probability distribution with a mean value of 15 m and a variance of 5 m². Determine the interval in which there will be tree heights in such a stand with a probability of 90%
 - A random 2
 A random sample of 40 families has an average water consumption of 29 cubic meters per month, with a sample standard deviation of 8 cubic meters. Give the 90% confidence interval for the mean usage of water per month.
 - Confidence interval
 A food testing laboratory in Abu Dhabi has been commissioned to estimate the amount of olive oil contained in 1-gallon tins purchased from a range of international olive oil producers. The manufacturers state that the standard deviation of the amount of o
 - US GDP
 Consider the following dataset, which contains the domestic US gross in millions of the top-grossing movies over the last five years. 300,452,513,550,780 I. Find the Mean of the Dataset II. Find the Squared deviation of the second observation from the mea
