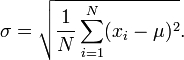
Standard deviation
Find the standard deviation for the following grouped data:
Your answer:
| Age (years) | Number of Persons |
|---|---|
| 0–10 | 15 |
| 10–20 | 15 |
| 20–30 | 23 |
| 30–40 | 22 |
| 40–50 | 25 |
| 50–60 | 10 |
| 60–70 | 5 |
| 70–80 | 10 |
Your answer:
Showing 1 comment:
Dr Math
Check also with our stddev calculator - input is given as frequency table:
https://www.hackmath.net/en/calculator/standard-deviation?input=5+15+25+35+45+55+65+75%0D%0Af%3A15+15+23+22+25+10+5+10
x is Mid Interval Value and f is frequency
https://www.hackmath.net/en/calculator/standard-deviation?input=5+15+25+35+45+55+65+75%0D%0Af%3A15+15+23+22+25+10+5+10
x is Mid Interval Value and f is frequency
Tips for related online calculators
Looking for help with calculating arithmetic mean?
Looking for a statistical calculator?
Looking for a standard deviation calculator?
Looking for a statistical calculator?
Looking for a standard deviation calculator?
You need to know the following knowledge to solve this word math problem:
statisticsGrade of the word problem
Related math problems and questions:
- Complaints
 The table is given: days; complaints 0-4; 2 5-9; 4 10-14; 8 15-19; 6 20-24; 4 25-29; 3 30-34; 3 1.1 What percentage of complaints were resolved within two weeks? 1.2 calculate the mean number of days to resolve these complaints. 1.3 calculate the modal nu
 - Dataset
 Data: 11,15,11,16,12,17,13,21,14,21,15,22 Find the dispersion of a given dataset.
 - Dataset: Dataset: 35 22 18 54 22 46 28 31 43 22 14 17 25 19 33 14. 1 Group the data into a grouped distribution using six classes of equal width. 2. Determine the mean, median, and mode using the raw data. 3. Draw an Ogive curve corresponding to the data and use i
- Grouped data range
 In grouped data classes such as 10-15, 16-20, 21-25, 26-30 with the respective frequencies of each class as 3, 5, 4, 3, then the range (range of variation) is: a. 15 b. 6 c. 20 d. 5
 - Squared deviation
 Given the data from the problem (sample data: 23, 27, 35, 44), find the sum of the squared deviations (the numerator of the fraction under the square root in the formula). In finding the number, round all calculations to 2 decimals (if you carry more or f
 - Marketing Year; money spent on advertising; profit 2008 2 12 2009 5 20 2010 7 25 2011 11 26 2012 15 40 1. draw a scatter diagram depicting the data. 2. calculate the Pearson's correlation coefficient. 3. determine the linear regression equation.
- Tennis aces
 The number of aces served by Novak Djokovic in the last 20 tournaments he has participated in is shown below. 12 17 13 7 8 14 11 14 10 12 15 9 11 13 6 15 18 5 19 24 1.1 using the raw, determine the range. 1.2 Group the data into a frequency distribution w
