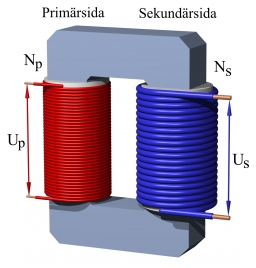
Transformer
Solve the textbook problems - transformer:
a) N1 = 40, N2 = 80, U2 = 80 V, U1 =?
b) N1 = 400, U1 = 200 V, U2 = 50 V, N2 =?
Your answer:
a) N1 = 40, N2 = 80, U2 = 80 V, U1 =?
b) N1 = 400, U1 = 200 V, U2 = 50 V, N2 =?
Your answer:
Tips for related online calculators
Check out our ratio calculator.
You need to know the following knowledge to solve this word math problem:
basic operations and conceptsthemes, topicsGrade of the word problem
Related math problems and questions:
- Remainders
 It is given a set of numbers { 200; 261; 331; 345; 487; 554 }. Divide these numbers by number 80 and determine a set of remainders. As a result, write the sum of these remainders.
 - Salami
 We have six kinds of salami, six of which have ten pieces, and one of which has four pieces. How many ways can we distinctly choose five pieces of salami?
 - Airport 4
 The airport in Košice collected the following data on aircraft delays within one week: (Solve the following tasks without classification into intervals. Round the results to 2 decimal places) Aircraft delay in min.: 541; 545; 575; 520; 572; 544; 524; 567;
 - Linsys2
 Solve two equations with two unknowns: 400x+120y=147.2 350x+200y=144
 - Principle - 3CC
 According to a certain principle, three-digit natural numbers are divided into two groups: The 1st group includes, for example, the numbers: 158, 237, 689, 982, 731, 422, … The 2nd group includes, for example, the numbers: 244, 385, 596, 897, … Discover t
 - The output
 The output voltage of the transformer is 880 V. The secondary coil has 1200 turns. Transformation ratio k = 4. Find the voltage to which the primary coil is connected. How many turns does the primary coil have if a current of 1 A flows through it? What cu
 - Transformer voltage
 The output voltage of the transformer is 880 V. The secondary coil has 1200 turns. Determine the voltage to which the primary coil is connected and how many turns it has if a current of 1 A flows through it. The transformation ratio is k = 4. What current
