Lengths 6
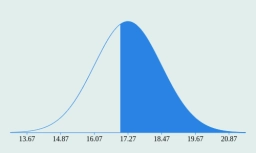
Lengths of 130 tubes are measured. The arithmetic mean is 17.27 cm, and the standard deviation is 1.2 cm. How many tubes do have a length:
a) between 16.5 cm and 18.1 cm
b) greater than 17 cm
a) between 16.5 cm and 18.1 cm
b) greater than 17 cm
Final Answer:

Tips for related online calculators
Looking for help with calculating arithmetic mean?
Looking for a statistical calculator?
Looking for a standard deviation calculator?
Looking for a statistical calculator?
Looking for a standard deviation calculator?
You need to know the following knowledge to solve this word math problem:
statisticsGrade of the word problem
Related math problems and questions:
- Suppose 8
 Suppose the scores on a test have a normal distribution with X=74 and a standard deviation of s=18. What percentage of students have scores higher than 90? What percentage of students have scores between 70 and 85? Twenty percent of the students do better
 - Statistical file characteristics
 Determine the median, mode, arithmetic mean, variance, standard deviation, range of variation, and coefficient of variation of the character x in the statistical file: 2x 9, 7x 10, 9x 11, 11x 15, 15x 17, 16x 19, 13x 21, 10x 25, 9x 29, 4x 32
 - The usage
 The battery usage time installed in a particular smartphone has a Normal distribution with a mean of 25.2 hours and a standard deviation of 7.5 hours. What is the probability of usage time greater than 32?
 - Dataset
 Data: 11,15,11,16,12,17,13,21,14,21,15,22 Find the dispersion of a given dataset.
 - Two fertilizers
 Jason is testing two fertilizers, Grow Well and Green Grow, so he went to a nursery and bought 50 tomato plants of the same variety. He planted all 50 plants in an identical environment. He then administered Grow Well to 25 of the tomato plants and Green
 - The average 7
 The average lifespan for cricket is 90 days, with a standard deviation of 13 days. If we assume that the lifespan of cricket is normally distributed, a. What is the probability a randomly selected cricket has a lifespan of fewer than 75 days? b. What is t
 - Dataset:
 Dataset: 35 22 18 54 22 46 28 31 43 22 14 17 25 19 33 14. 1 Group the data into a grouped distribution using six classes of equal width. 2. Determine the mean, median, and mode using the raw data. 3. Draw an Ogive curve corresponding to the data and use i
