Digging
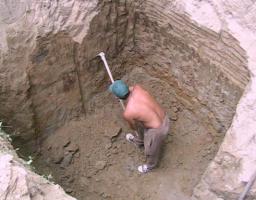
A pit is dug in the shape of a cuboid with dimensions 10mX8mX3 m. The earth taken out is spread evenly on a rectangular plot of land with dimensions of 40 m X 30 m. What is the increase in the level of the plot?
Your answer:
Your answer:
Tips for related online calculators
Do you know the volume and unit volume, and want to convert volume units?
You need to know the following knowledge to solve this word math problem:
solid geometryUnits of physical quantitiesGrade of the word problem
Related math problems and questions:
- Cesspool pit excavation
 The Horniakovs dug a pit for a cesspool in the shape of a cuboid with bottom dimensions of 40*40 dm and a depth of 350 cm. A) How many cubic meters of soil did they dig up? B) The excavated soil was evenly spread and pressed onto a rectangular area measur
 - Gas pipeline excavation
 During the construction of a 140-meter-long gas pipeline, a pit with vertical walls 1.5 m deep and 1 m wide must be created. A) How many cubic meters of soil must be dug up? B) We spread the excavated soil evenly on a field with dimensions of 70 m and 120
 - Plot dimension calculation
 The rectangular plot has an area of 480 m². One of its dimensions is 30 m. Calculate the second dimension of the plot.
 - Rectangular land
 On a rectangular plot of land with dimensions of 35 m and 18.5 m is a house with a square floor plan with a side of 14 m. What % of the land is not occupied?
 - Dimension of foundations
 The foundation pit for building houses has a face of blocks with dimensions of 10 meters, 10 meters, and 2 meters. After a heavy rain, the water is filled to the brim. The pump pumps out 10 m³ of water in 1 hour. In how many hours will the pit be empty?
 - Plot dimension increase
 The surface area of the rectangular plot needs to be increased by 33.7 percent. One dimension was extended by 2.9 percent. By what percentage should the second dimension be increased? Round the result to two decimal places.
 - Bivariate data set
 Here is a bivariate data set in which you believe y to be the response variable. x y 51.4 44.8 60.2 46.6 60.1 46.8 45.8 46.3 37.4 41.8 72.4 52.5 60 48.2 67.5 49.5 60.9 49.8 51.1 45.7 62.7 49.6 194.9 84.2 Make a scatter plot of this data. Which point is an