Rich retirement
Healthcare issues are receiving much attention in both academic and political arenas. A sociologist recently surveyed citizens over 60 years of age whose net worth is too high to qualify for government health care but who have no private health insurance. The ages of 25 uninsured senior citizens were as follows: Suppose the mean and standard deviation are 74.0 and 9.7, respectively. If we assume that the distribution of ages is bell-shaped, what percentage of the respondents will be between 64.3 and 93.4 years old?
Your answer:
Your answer:
Showing 1 comment:
Dr Math
See normal distribution calculator:
https://www.hackmath.net/en/calculator/normal-distribution?mean=74&sd=9.7&above=0.0767&below=&area=between&ll=64.3&ul=93.4&outsideLL=&outsideUL=&draw=Calculate
or use z score and table lookup
https://www.hackmath.net/en/calculator/normal-distribution?mean=74&sd=9.7&above=0.0767&below=&area=between&ll=64.3&ul=93.4&outsideLL=&outsideUL=&draw=Calculate
or use z score and table lookup
Tips for related online calculators
Looking for help with calculating arithmetic mean?
Looking for a statistical calculator?
Looking for a standard deviation calculator?
Would you like to compute the count of combinations?
Looking for a statistical calculator?
Looking for a standard deviation calculator?
Would you like to compute the count of combinations?
You need to know the following knowledge to solve this word math problem:
statisticscombinatoricsGrade of the word problem
Related math problems and questions:
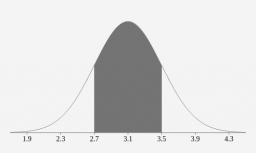
- Bell curve
 A company has a policy of retiring company cars; this policy looks at the number of miles driven, purpose of trips, style of car, and other features. The distribution of the number of months in service for the fleet of cars is bell-shaped and has a mean o
 - Respondents - chi-square
 Asked respondents answered a question about their average net monthly wage. The given answers are in thousands €: 0.40; 0.60; 0.55; 0.68; 0.63; 0.70; 0.65; 0.75; 0.91; 0.63; 0.38; 0.39; 0.38; 0.74; 1.25; 1.10; 1.30; 1.15; 1.18; 1.13; 1.15; 1.19; 1.21. Usi
 - Normally distributed
 Suppose the height of male youngsters is normally distributed with a mean of 60 inches and a standard deviation of 10. what percentage of the boy's height would we expect to be between 44 and 75, less than 49, and 76 and more?
 - 68-95-99.7 rule
 Assume the resting pulse rates for a sample of individuals are normally distributed with a mean of 70 and a standard deviation of 15. Use the 68-95-99.7 rule to find the following quantities. a. Percentage of pulse rates less than 70 b. Percentage of puls
 - Mortality tables
 Mortality tables enable actuaries to obtain the probability that a person will live a specified number of years at any age. Insurance companies and others use such probabilities to determine life insurance premiums, retirement pensions, and annuity paymen
 - Standard deviation
 Find the standard deviation for the following grouped data: Age (years); Number of Persons 0–10; 15 10–20; 15 20–30; 23 30–40; 22 40–50; 25 50–60; 10 60–70; 5 70–80; 10
 - Students 34
 Students were surveyed as part of a Statistics project to determine if younger adults are more likely to have tattoos. The results are listed in the two-way table below: age; At least one tattoo; No tattoo; Row totals Age 18 - 29; 165 ; 342; 507 Age 30 -
