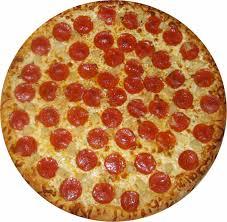
Pizza
Pizza with a diameter of 40 cm weights 409 g. What diameter will a pizza weigh 764 g made from the same cloth (same thickness) and decorated?
Final Answer:

Tips for related online calculators
Check out our ratio calculator.
Tip: Our Density units converter will help you convert density units.
Tip: Our Density units converter will help you convert density units.
You need to know the following knowledge to solve this word math problem:
arithmeticsolid geometryplanimetricsbasic operations and conceptsUnits of physical quantitiesGrade of the word problem
We encourage you to watch this tutorial video on this math problem: video1
Related math problems and questions:
- Salami
 We have six kinds of salami, six of which have ten pieces, and one of which has four pieces. How many ways can we distinctly choose five pieces of salami?
 - The square
 The square oak board (with density ρ = 700 kg/m3) has a side length of 50 cm and a thickness of 30 mm. 4 holes with a diameter of 40 mm are drilled into the board. What is the weight of the board?
 - Z-score
 The mean adult male pulse rate is 67.3 beats per minute, with a standard deviation of 10.3. Find the z-score for an adult male's pulse rate of 75. (Round the z-score to two decimal places. )
 - Dogs weights
 Four out of nine dogs weigh less than 20 pounds. What is the decimal equivalent for the number of dogs weighing less than 20 pounds?
 - Copper plate
 Copperplate length 9 m and width 56 cm weigh 48.38 kg. What is the plate thickness if 1 m³ of copper weighs about 8700 kg?
 - Pupils - dataset
 The following data on the height and the corresponding number of pupils were found in the measurement of 63 pupils: the height; number of pupils 159cm; 1 161cm; 1 162cm; 2 163cm; 1 164cm; 2 165cm; 2 166cm; 3 167cm; 2 168cm; 4 169cm; 3 170cm; 5 171cm; 6 17
 - Lid
 What is the weight of the concrete cover (lid) to a round shape well with a diameter 1.65 m if the thickness of the cover is 9 cm? 1 m³ of concrete weighs 2190 kg.
